Chapter 6: Case Studies
6.1 Stanford Open Data Project
Written by the Stanford Open Data Project team
6.1.1 Problem
As we worked on data-driven projects at Stanford University, we realized that data about the university was difficult to find and use. In particular, university data was typically (i) held by a disaggregated set of student groups, administrative departments, and websites; (ii) in unstructured format, like PDFs. Data also lacked context to help potential users identify possible avenues for use. Furthemore, student journalists often performed redundant work, recreating datasets and analysis that others had conducted. We saw the need for a reliable cross-group centralized data store, especially at an institution with a multi-billion dollar endowment and tens of thousands of students and employees.
6.1.2 Vision
We aimed to help student journalists find and use the data they needed to publish data-driven insights about the university. We also recognized that a tool for student journalists would be inherently valuable to the campus community at large. Thus, we set out to build an open data portal for the student newspaper, with an eye toward broader use and adoption by their peers. We envisioned a centralized platform with a variety of accessible and valuable datasets from across the university and came to the following mission statement: The Stanford Open Data Project aims to collect and open up datasets Stanford’s campus in order to enable community members to
6.1.3 Process
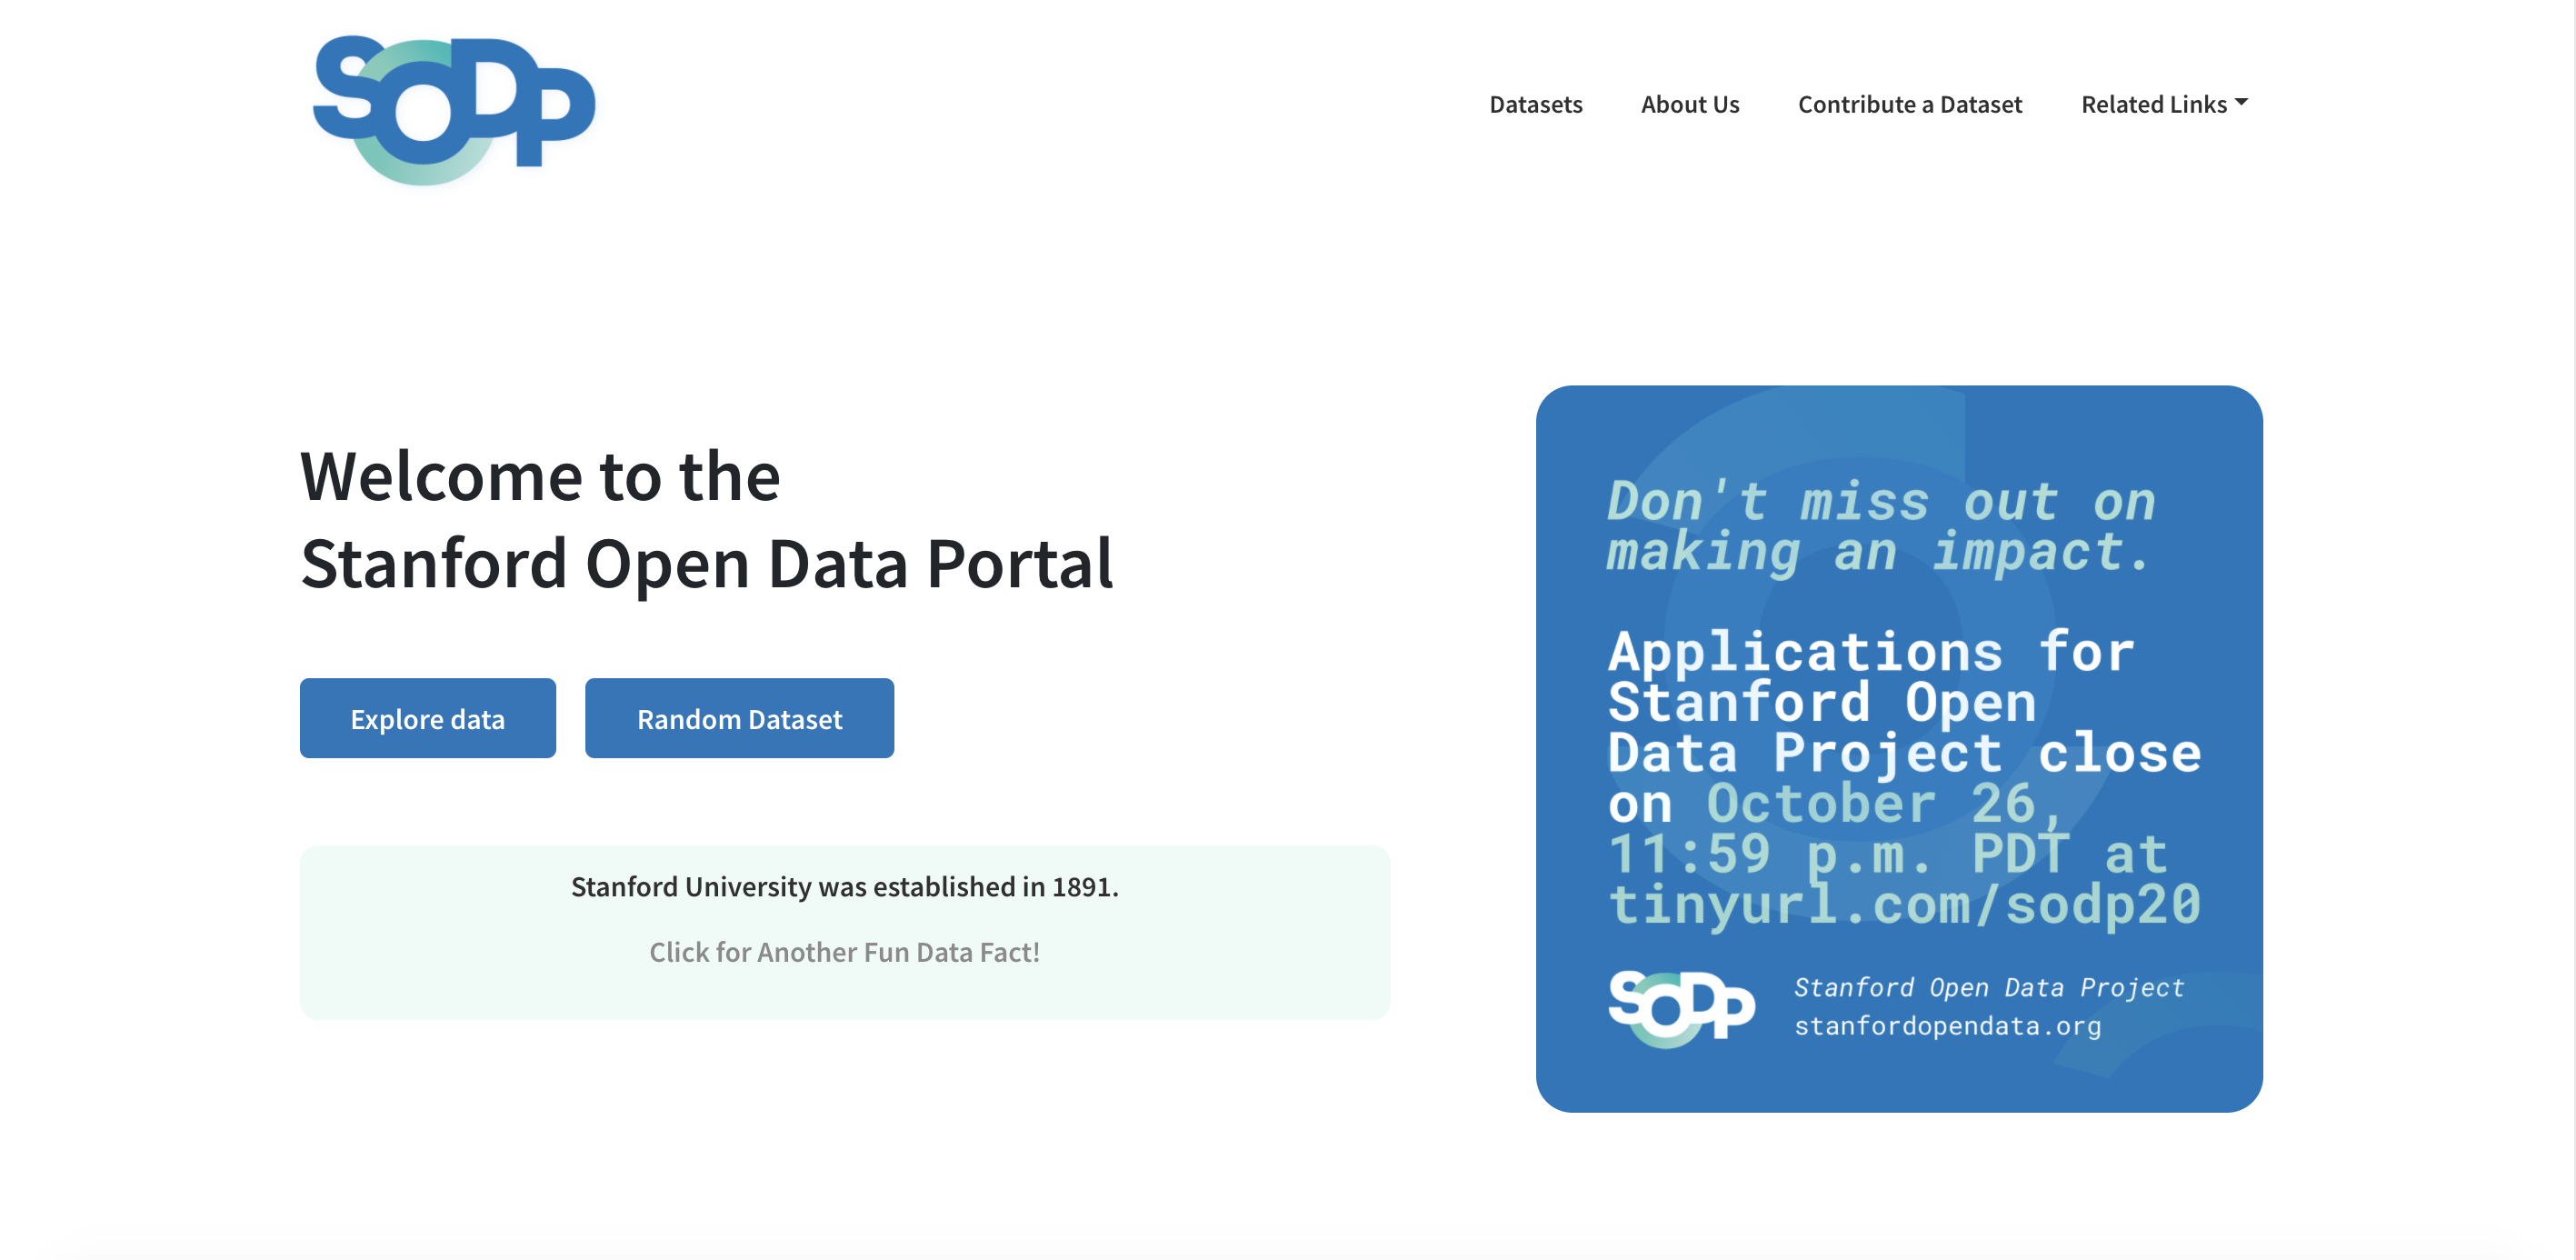
The Stanford Open Data Project formally began in February 2019 under a partnership with the Stanford Daily newspaper. Our initial focus was building the open data portal to host datasets. Thus, shortly after starting the project, we held a one-day mini-hackathon (i.e. extended work session) to build out the basic frontend and backend structure. Then, we conducted extensive user research of journalists under the Coding it Forward Build Program in Spring 2019 and finished a barebones product by Summer 2019, but it was not ready to launch publicly. We spent the summer improving the UI/UX quality of the product. We also explored alternate design frameworks; after attempting to utilize CKAN, a common open data framework for governments worldwide, we instead settled on a simple React-based framework using a style inspired by other projects at the Stanford Daily. We launched our website in September 2019 and started formally marketing it in March 2020.
Throughout the period of website development, the team focused its data collection efforts on more easily accessible datasets, such as those published online and those used in previous Stanford Daily publications. Currently, with the website released, the team has shifted its focus to developing partnerships with Stanford administration, student government, and other campus organizations. The team has also started designing surveys and collecting new data, such as the Stanford Community Survey, and aims to expand these efforts in the near future.
6.1.4 Result
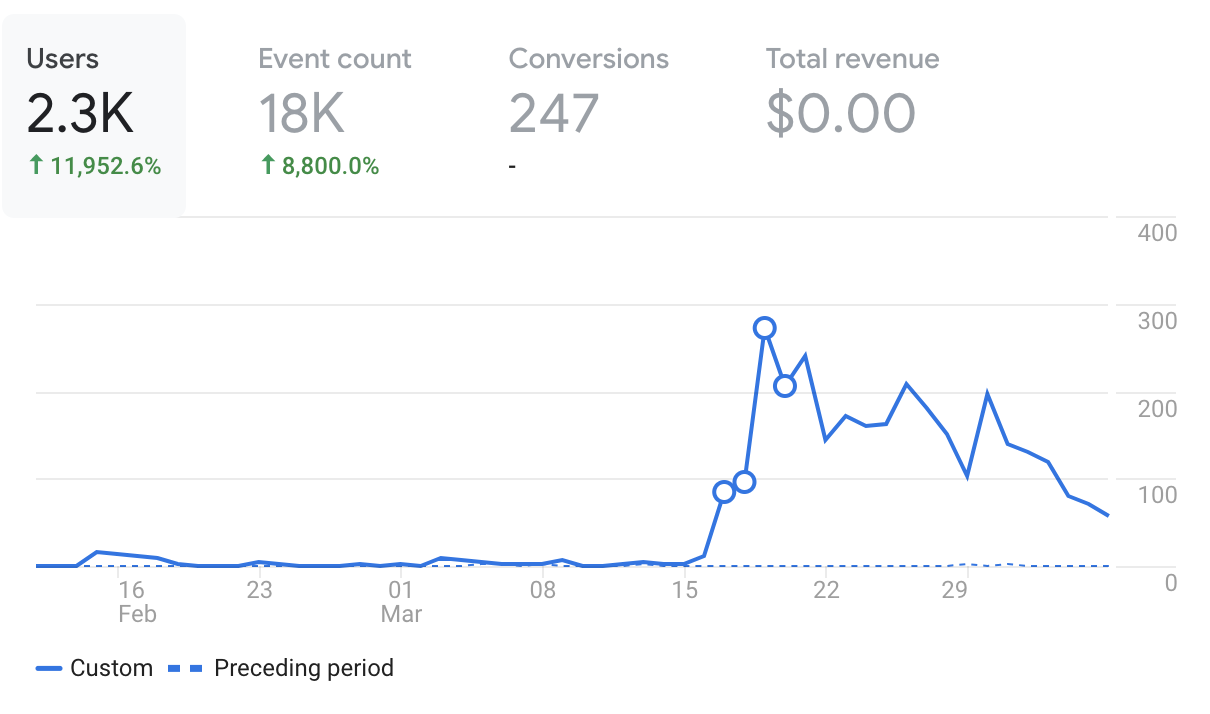
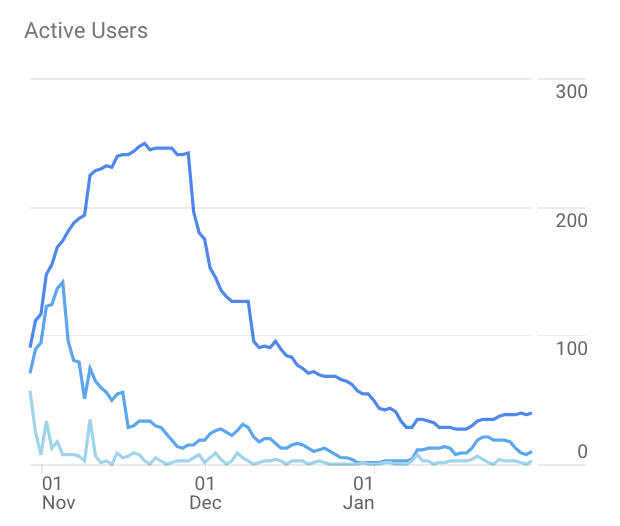
This result highlights the importance of partnerships with other product-oriented individuals and groups. The team finished development of their new portal in winter 2020 and quickly launched their portal on the Stanford daily website. At first, usership was low. But soon, the team established a policy with the newspaper where all new datasets used for data journalism articles would be submitted to the open data portal. Furthermore, several journalists began projects using data found on the portal itself. Throughout winter 2020, the portal had 10-20 Daily Active Users (DAU) but by the end of the winter, the DAU’s took off. The Daily data journalism team launched a landmark coronavirus visualizations story covering Santa Clara County and 11 surrounding counties and directed readers to the Stanford Open Data Portal to view the cleaned data and other data on COVID-19. Our work led to an award-winning news article and several researchers began using our portal for COVID-19 data.
6.1.5 Lessons Learned
Throughout the process, the Stanford Open Data Project team has gained the following insights:
- Simplicity is key: using CKAN or having a fleshed out server may seem appealing, but complex approaches are not always necessary for the needs of an open data portal. Simplicity enables broad access for even novice programmers and will move you closer to the finish line.
- Do an incubator program early in the process to build structure. The Stanford team benefited greatly from the Coding it Forward Build program fellowship.
- Building an open data portal is easy; building a useful and impactful portal is hard. Obtaining users who derive value relies on understanding your user and building alongside them. We found our primary user base in the Stanford Daily and engaged in user research early on.
- Establish relationships with organizations to achieve the following
- Establish a pipeline of datasets into the portal
- Ensure frequent use of data
- Display portal on partner websites
- Establish more frequent contact with a faculty advisor. Experience pays and faculty who understand the technical aspects of building a portal or the social aspects of creating a usable portal are invaluable.
6.2 Northwestern Open Data Initiative
Written by the Northwestern Open Data Initiative team
6.2.1 Problem
The Northwestern Open Data Initiative was founded to increase the accessibility and transparency of Northwestern University’s data ecosystem. We noticed two fundamental problems. First, the Northwestern community — students, faculty, and staff — did not know what datasets existed and where to find these datasets. Second, most datasets were locked up in PDFs. disincentivizing and, to some extent, preventing curious Northwestern community members from analyzing or visualizing these datasets. For example, we learned that the Daily Northwestern, Northwestern’s student-run newspaper, was manually inputting data from a PDF into Adobe Illustrator to create visualizations.
6.2.2 Vision
The Northwestern Open Data Initiative aims to give our community access to the data that serves them. We established a three-pronged approach: build, educate, and engage.
- Build: We will develop an open data portal to provide clean, usable, and easily downloadable data. We will foster a relationship with the Office of Institutional Research to source datasets.
- Educate: We want to teach both the Northwestern community, as well as students at other universities, how to start a conversation around ‘data’ — its analysis, interpretation, and governance.
- Engage: We aim to transition to a student group that maintains and builds on the portal, finds new use cases for the portal, and constructs mechanisms to engage the community.
6.2.3 Process
The Northwestern Open Data Initiative started in January 2020 with a team of six students. We were able to build our idea within Computer Science Professor Kristian Hammond’s Independent Study class (allows course credit).
Our initial focus was to build partnerships with key stakeholders to understand our user-base. We met with Northwestern’s Assistant Vice President for Information and Analytics, the Institutional Research Office, and the Data Governance group; joined a startup incubation program in the Garage, a student entrepreneurship space at Northwestern; participated in the ImproveNU pitch competition; and conducted university-wide surveys.
Over the course of the next 8 months, in the midst of the pandemic, we built an open data portal (a full-stack Django-React hybridized server and AWS S3) to host datasets and secured over twenty machine-readable datasets from the Institutional Research Office. We held weekly sprints to build key product features, create a user-centered design, and integrate our data governance protocol into the product; continued to meet with the Assistant Vice President for Information and Analytics to identify and acquire datasets; and started a collaboration with the Stanford Open Data Portal team to create this guide and, more specifically, a data governance protocol.
6.2.4 Result
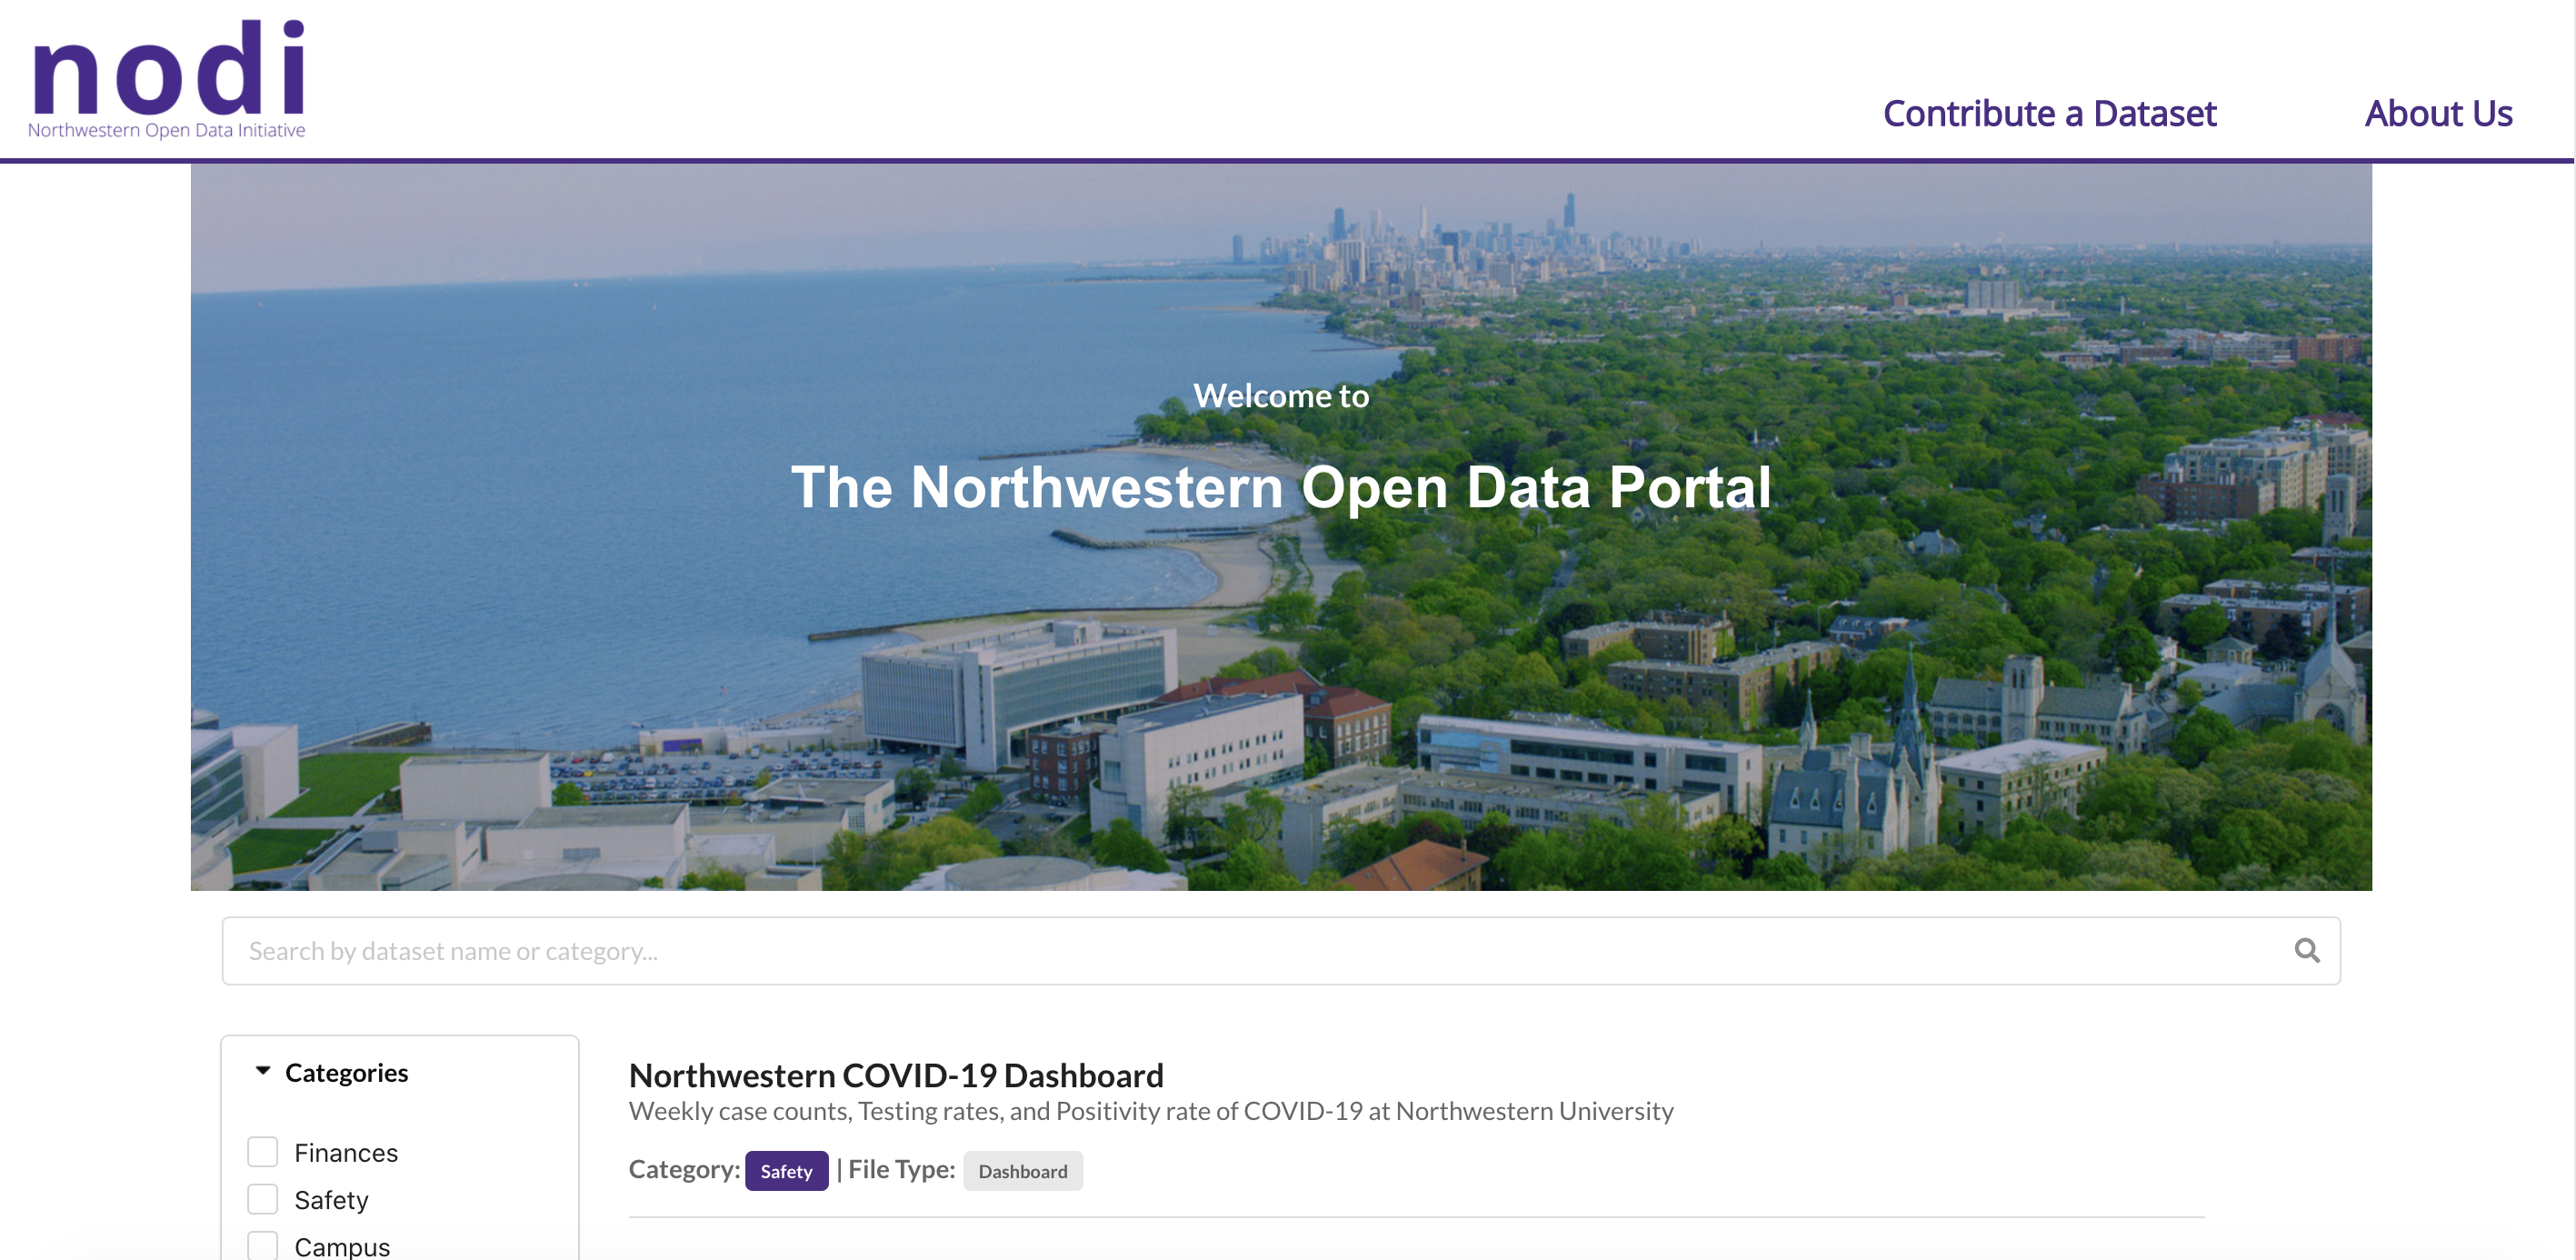
By the fall of 2020, we launched the Northwestern Open Data Initiative. We are averaging about 10 users per week. Currently, we are working with our newly-recruited cohort to transition the project, build new features, and promote awareness and usage of the portal.
Our work on the portal helped data-journalism pieces that have been featured in the Chicago Sun-Times . Recently, our group won the Fall 2020 Wildcat Impact Award, an award that “recognize[s] students who have significantly contributed to improving the quality of student life during the past academic term at Northwestern”.
6.2.5 Lessons Learned
Throughout the process, the Northwestern Open Data Initiative team has learned some lessons:
- Although CKAN may seem more appealing, the documentation is complex and not fully built out. A web application is more conducive to collaborative development and customization.
- Passion is contagious. If you are genuinely passionate about building an open data portal, your faculty advisor, teammates, and any other colleagues will start to feel the same way.
- Start with a structured approach to technical development. Looking back at the first ten weeks, we struggled with coordinating tasks for building out the portal and that hampered our efficiency as a team. After implementing an agile methodology, we were able to have more accountability and make more progress.
- Source out mechanisms at your university to incentivize work on the project. In our case, we created the Northwestern Open Data Initiative under Professor Kristian Hammond’s Independent Study Project class. Having major credit, a grade, and weekly check-ins with our professor helped hold the team accountable.